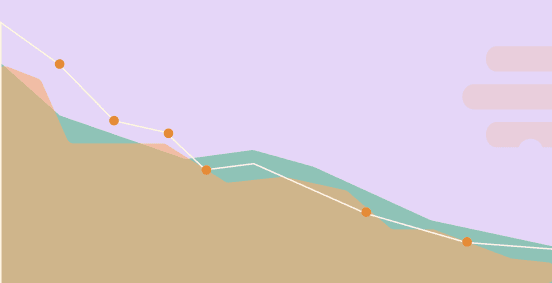
If you’re working on special projects and need to keep track of you (and your team’s) progress, use a burndown chart. While it might sound scary or complex, we promise, it’s not.
A burndown chart is a common visual tool used to track progress within a project. It is a line graph that illustrates the amount of work remaining on a project versus how much time is available. This visual aid helps teams to monitor progress in an effective and timely manner.
Where is a Burndown Chart Used?
Burndown charts are most commonly used in the agile software development methodology where tasks are broken down into smaller, achievable goals. This ensures that teams are able to focus on the tasks ahead of them rather than become overwhelmed by the more complex broader view of the project.
How a Burndown Chart Works At Work
A burndown chart consists of two axes: time on the x-axis and effort remaining on the y-axis. The vertical axis plots the estimated effort remaining from the start of a project until its completion. The horizontal axis represents the amount of time available for a project’s completion. On the chart itself, each day on the time axis shows a corresponding plot point.
- The plot points seen on the chart are calculated by subtracting the number of completed tasks from the total effort required for the project. As tasks are completed and progress is made, they plot further down the chart until they reach zero.
- The goal of a burndown chart is to ensure that tasks are evenly spaced and that a team stays on track during a project’s timeline.
- By tracking progress and making adjustments as necessary, burndown charts can help a team finish a project on time.
How to Use a Burndown Chart Yourself
Creating a burndown chart is as easy as comparing the estimated effort and progress as each day passes. As tasks are completed, plot their progress on both the time and effort axes. Track the completion of tasks over time to create a burndown chart and observe the overall progress.
To stay up to date on the burndown chart throughout the project’s timeline, teams should dedicate time weekly to evaluate the burndown rate. This is a process used to determine if a project is on track to meet its deadline. By doing this, project leaders have more visibility into the project’s progress and can adjust as needed.
Used for decades, the burndown chart is an invaluable tool for teams to monitor their progress over time. This simple visual display allows teams to stay on track with tasks and meet their deadlines with greater efficiency. By diligently tracking progress and making adjustments with the burndown chart, teams are best suited to finish the project on schedule.
