Project management and task tracking software are invaluable assets for teams and organizations around the world. As remote and hybrid organizations figure out their ideal ways of working, having a central place to track tasks and manage projects is critical. Centralizing projects, chats, and work in general means that you also have a built-in backlog of everything your team has accomplished. Better yet, you probably have a way to dissect and learn from that information and reporting.
Understanding progress across workspaces, projects, and tasks from an analytics standpoint is critical to success in many ways. Tracking completion of tasks and projects, or where things may be held up, allows teams and leadership to have visibility into activity at a high level. With this information, leadership or team managers can make decisions about progress or where to allocate additional resources.
Workspace reporting also means that even in a hybrid work environment, all team members can be on the same page with goals and status. Instead of bringing various team members into a Zoom meeting for a quick update, team leads can check progress at a high level to determine if they even need to have that meeting in the first place. When a team is aligned and clear on goals and progress, it gives everyone additional motivation to accomplish what they need to and get their tasks done.
Analytics and reporting in workspaces, like Hive, is also important because it makes the exporting and sharing of progress very easy. Instead of creating your own pivot tables, charts, and more in Excel, just open up the Analytics app and export a PDF or image to send to your team.
Getting Started With Hive Analytics
These are just a few of the reasons that Hive Analytics, our in-house analytics wiz that digests and reports on data for you, is such an important app used by teams around the world. With Hive Analytics, accessible in the Hive Apps store, teams can view insights in succinct dashboards.
Note: Hive Analytics is an add-on, which can be purchased for your team by your team admin. If you need a longer trial period to test Analytics, please email us at hq@hive.com
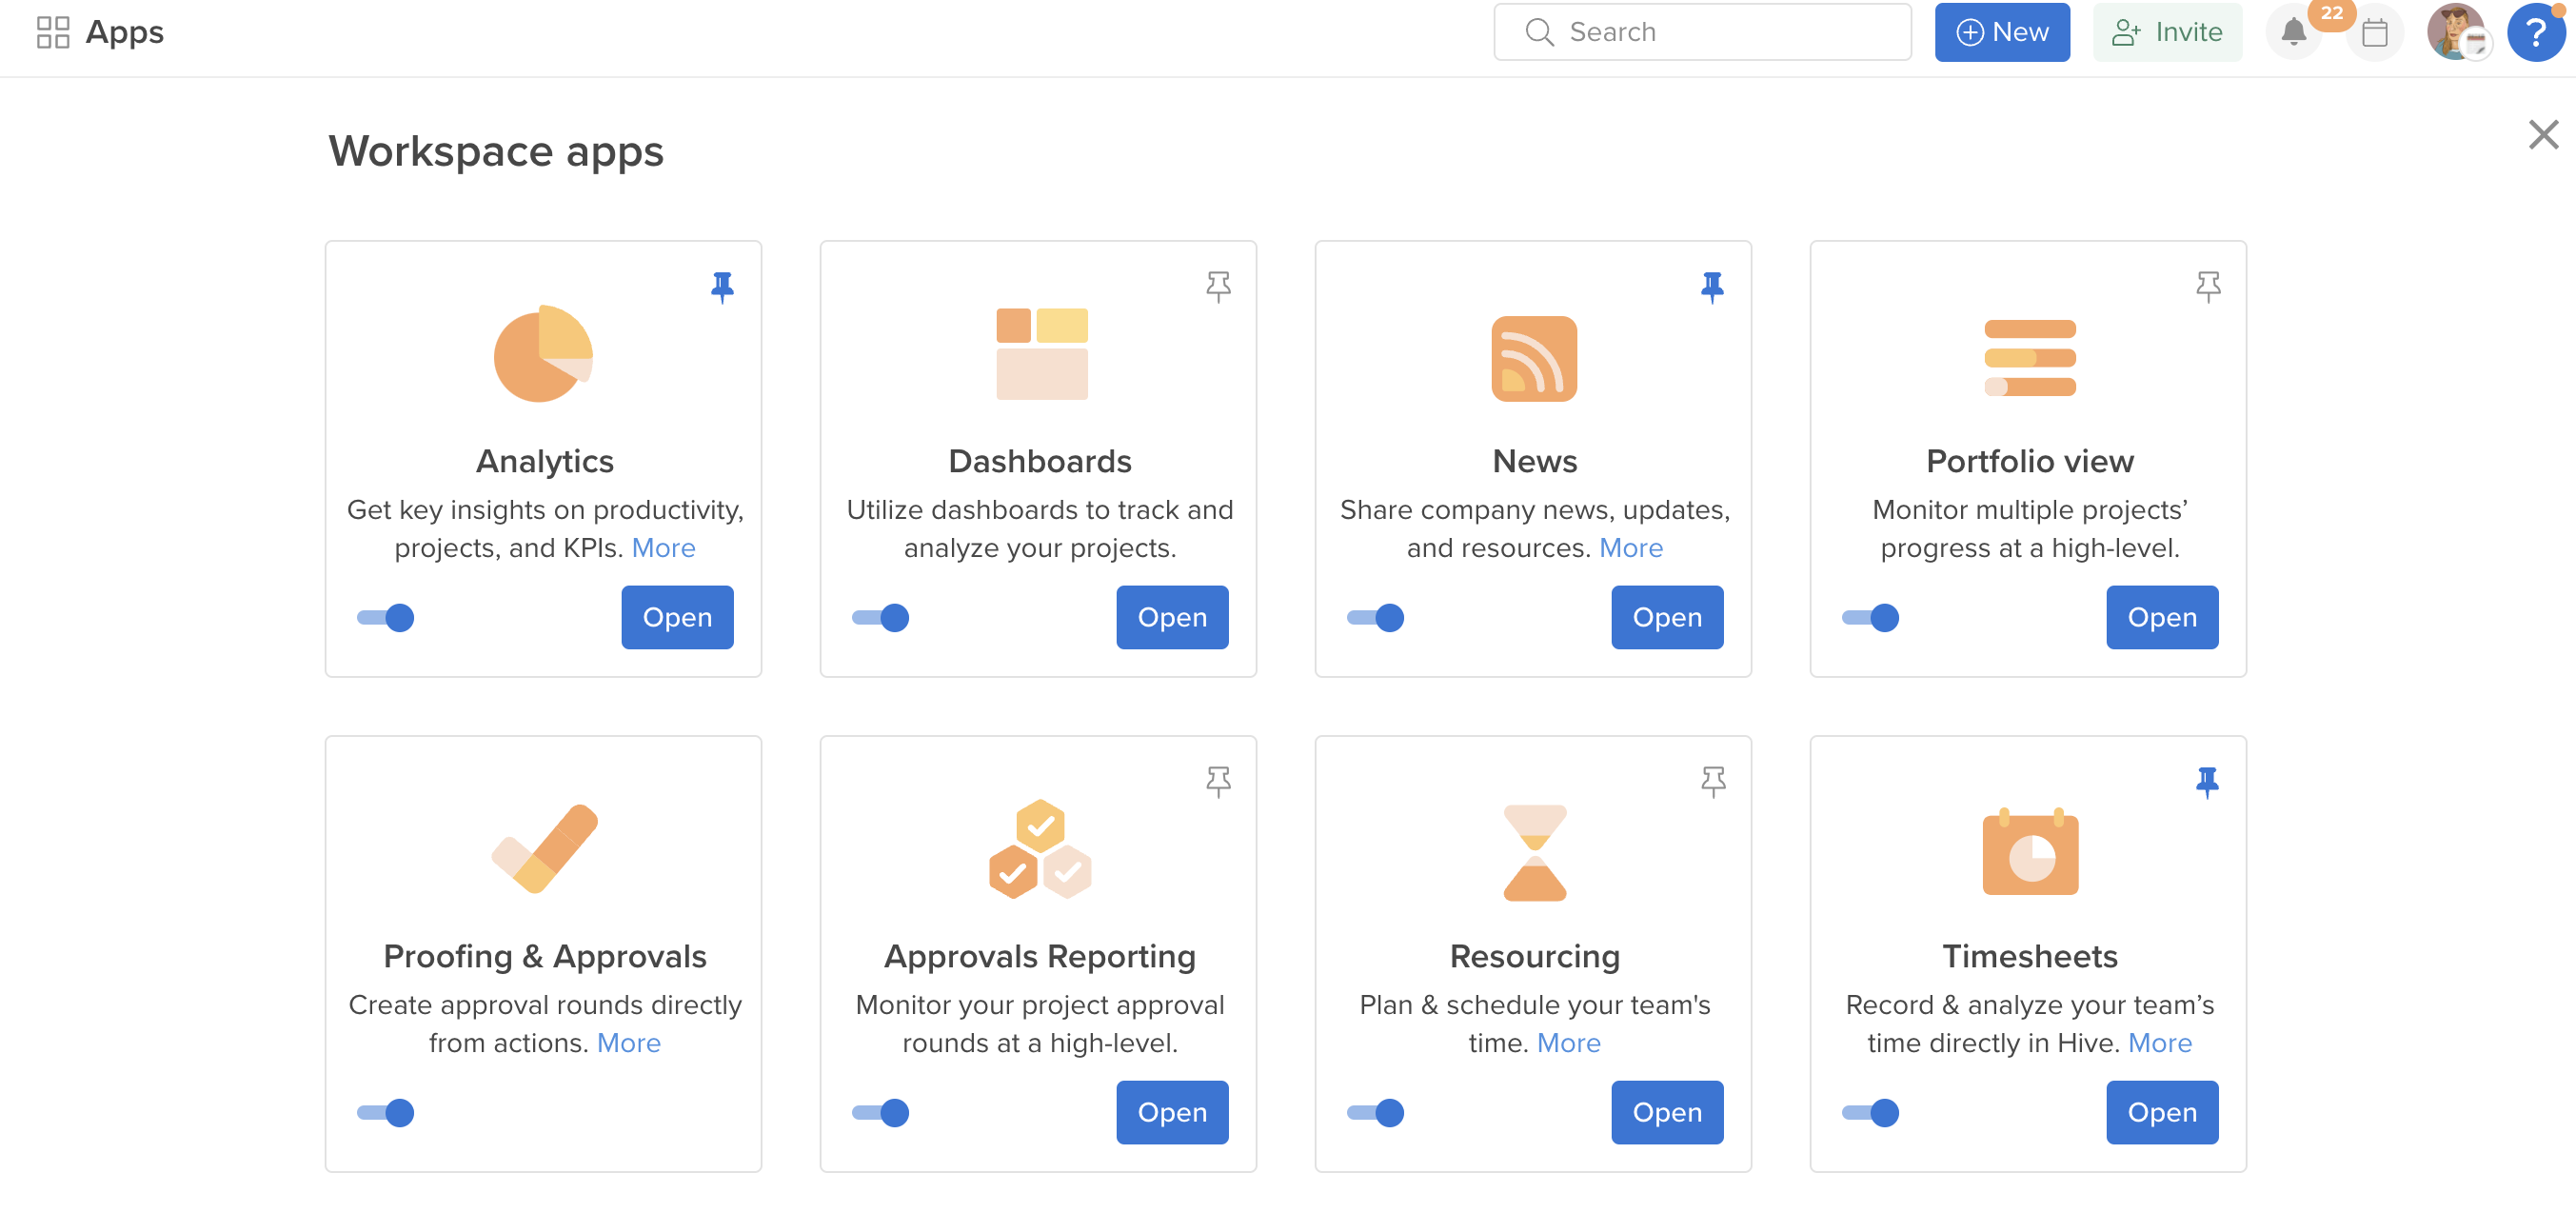
To access Hive Analytics:
- Select “Apps” from your dashboard sidebar
- Ensure that your Hive Analytics box is toggled on in Hive Apps
- Pin the app by clicking the pin button in the upper right corner to save the app to your dashboard sidebar
- Once turned on, click into the Analytics app
- Select your desired dashboard on the left-hand panel
Building Blocks of Hive Analytics Dashboards
Once you’ve located your preferred dashboard, the next step is understanding it’s different pieces.
- Timestamps: This is the time indicated in the top left corner, showing when the data was last updated. Data is updated about every 3-4 hours daily.
- Filters: These allow you to filter the data in any way you’d like (they can only be applied at the dashboard level). Users can filter by action, project, owner, status, date, and more, as well as set a default filter status that will be the standard filter setting for each dashboard. These filters are available on the right hand side of each dashboard. An important thing to note is that, when setting filters from the List menu, they can act as inclusionary or exclusionary – depending on how you select your values. If you want to filter a dashboard to show all data except certain values, you can deselect those specific values to exclude them from your dashboard. If you want to filter your dashboard to show only certain values, you can deselect all values, and then only select the specific values you would like to be included. You can filter your dashboard by clicking into charts, utilizing our easy-filtering buttons, or using the filter panel on the right side of the dashboard. Finally, you can always reset your filters by clicking on the arrow at the top of the filters panel.
- Widgets: Widgets are the building blocks of your analytics dashboard and include charts, graphs, pivot tables, number counters, and more. They will have titles at the top of the widget that say things like “Projects by Current Status” or “Total Projects.” Each widget has an “i” button on the top right which shows the time it was last updated as well as three “More” dots, which allow you to quick-export the widget.
- Exporting: Individual widgets or entire dashboards can be exported from your dashboards as image, CSV, and for some widget styles, Excel.
Dashboards Available in Hive Analytics
Workspace Overview
When you start your Hive Analytics journey, there will be a handful of dashboards available to you immediately. In this article, we will go over the most commonly used dashboard, which is Workspace Overview. Use this dashboard to quickly and easily access data about trends in your workspace, projects, actions, and more. Below is a snapshot of a workspace overview dashboard, where you can see each widget as well as the filters on the right hand side.
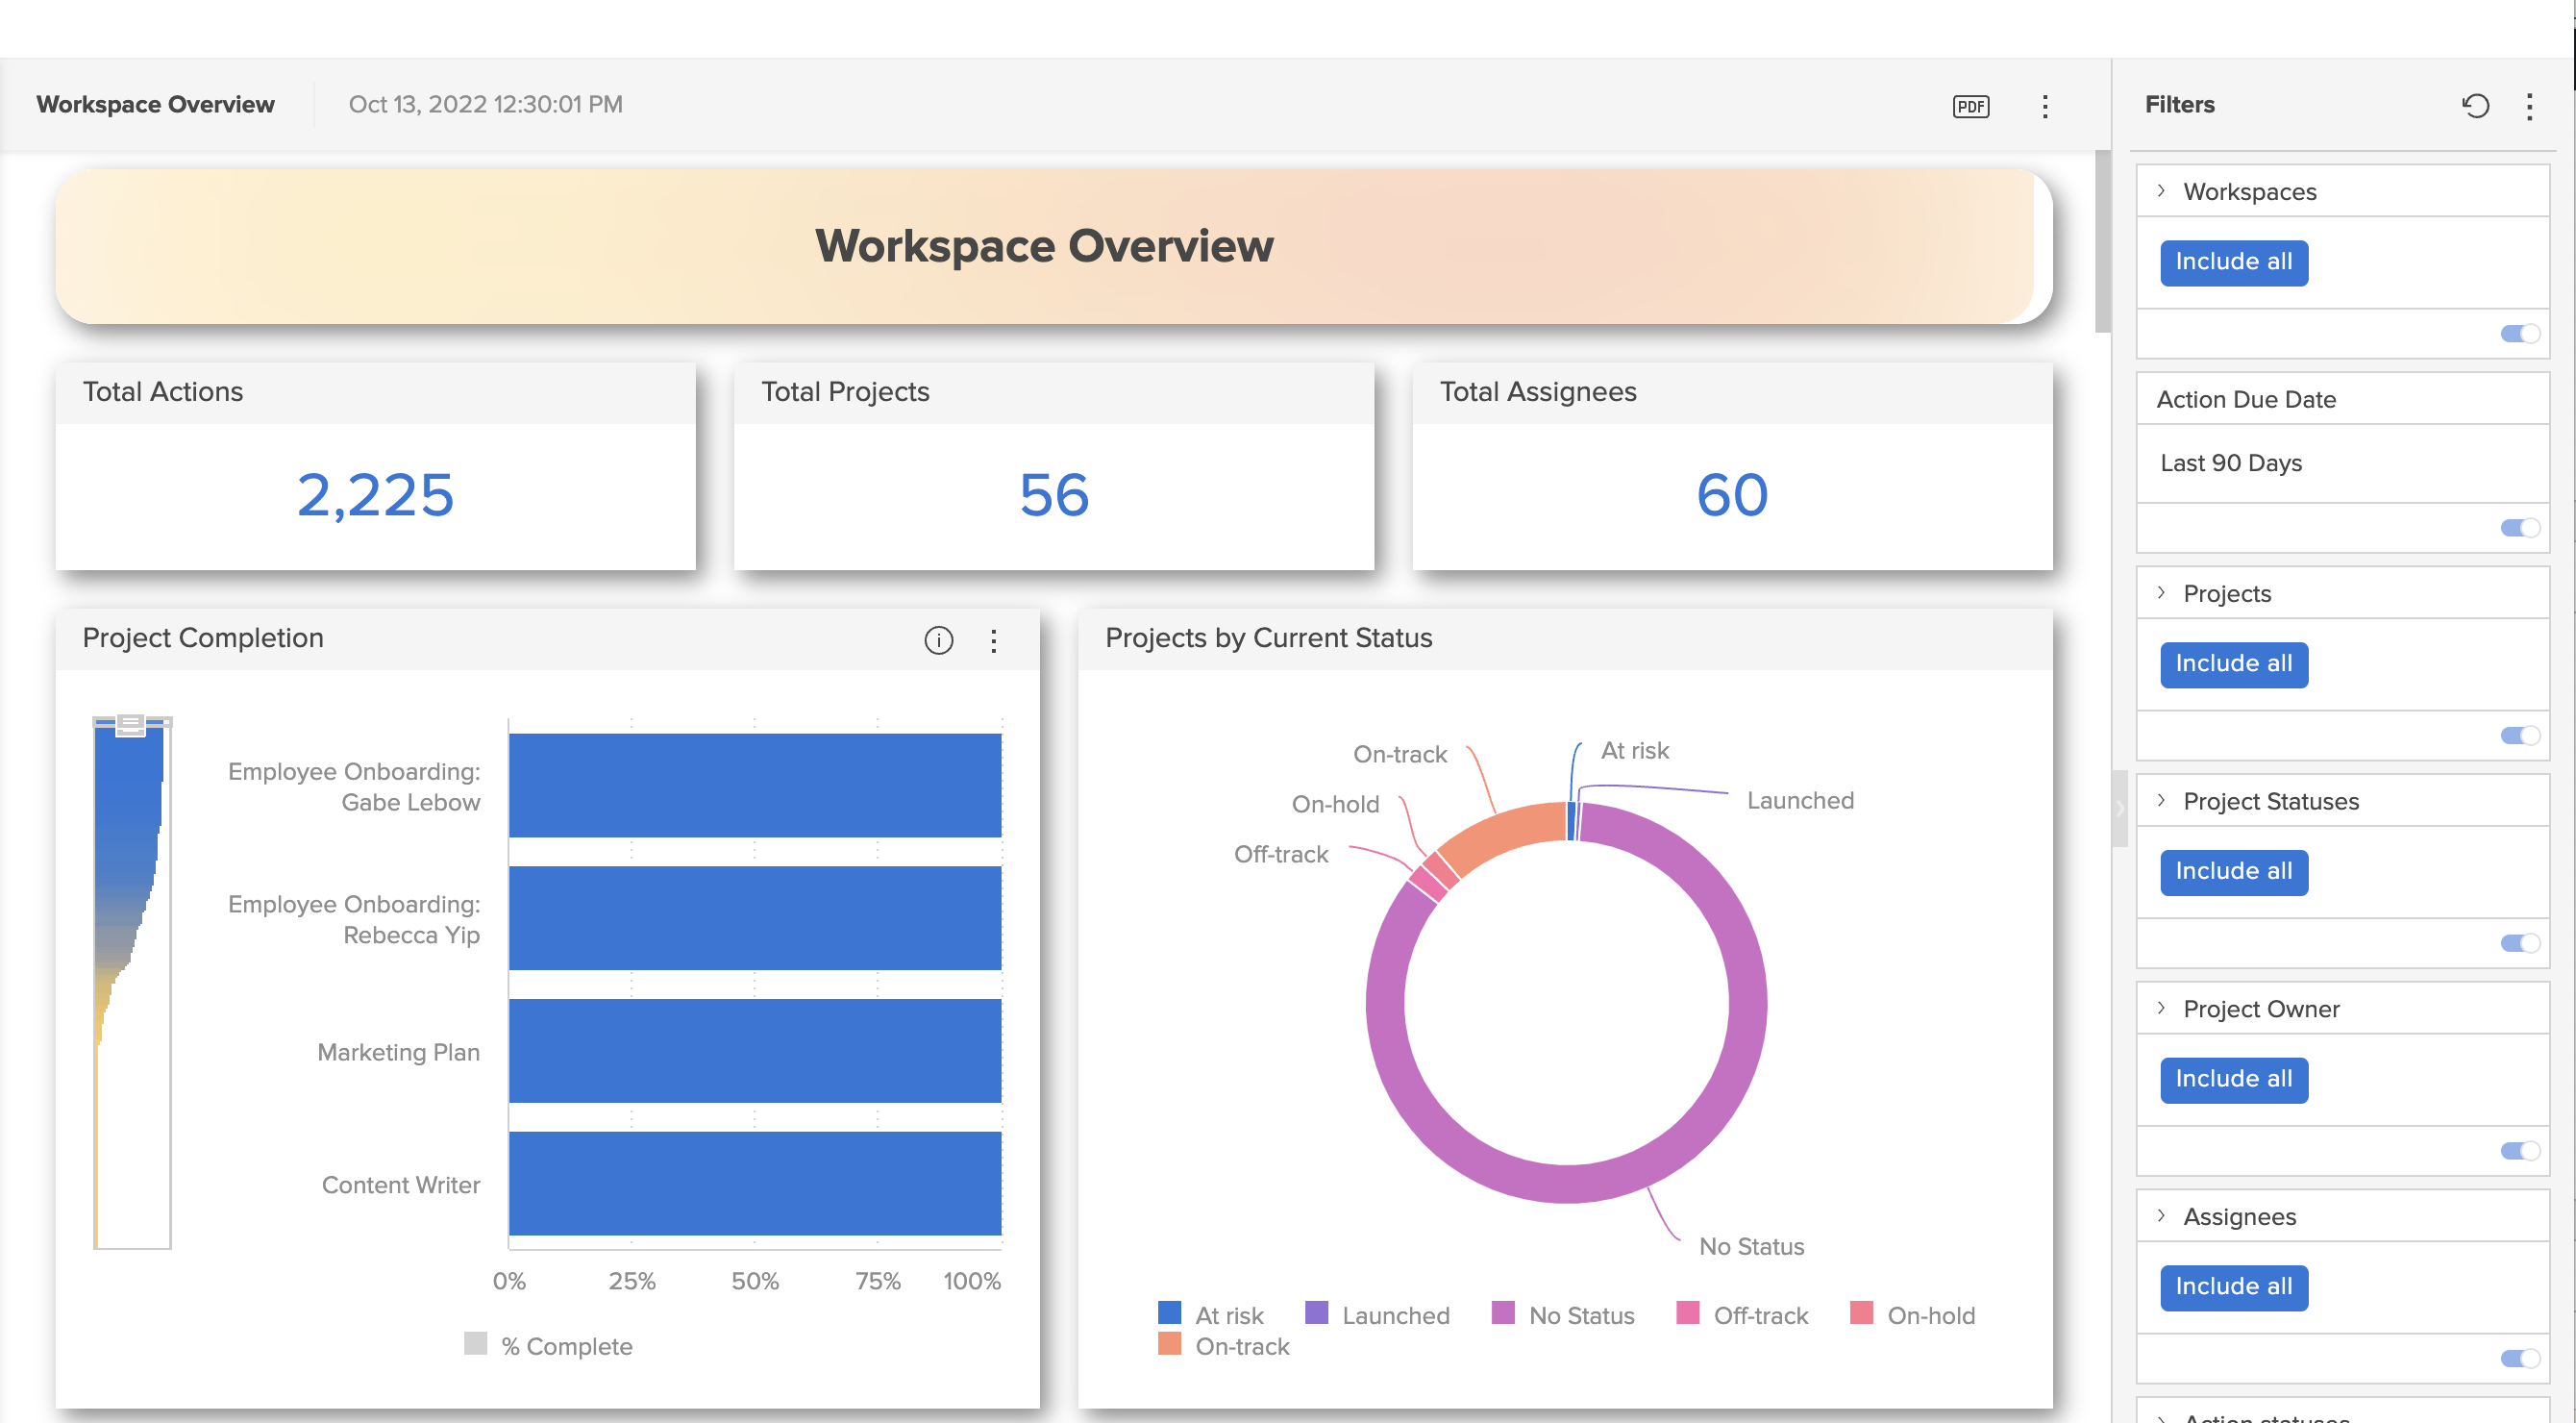
As the name suggests, this dashboard gives you a general overview of all activity happening in your workspace, including four main sections:
- General Workspace Overview – This section gives you access to data like total actions assigned, total existing projects, total actions assigned, and more
- Overdue Actions – This section highlights overdue actions by assignee, label, action status, and more.
- Actions Due – This section provides a breakdown of actions due across a select timeframe.
- Actions Completed – This final section highlights and details all actions completed by assignee, label, and week.
Custom Analytics Dashboards
In addition to the select existing dashboards in Hive Analytics, we offer the ability to build custom dashboards for you and your team. Our Professional Services team is always available to assist with building custom dashboards – please contact our support team to set up a consultation, or email us at hq@hive.com. We’d love to help!
Additionally, join us at Hive University to find short Analytics tutorials and overview videos for our most popular dashboards, where we cover everything from the basics to the most advanced aspects of Hive Analytics.