Table View enables you to view, organize and edit information within a selected project, very much like a spreadsheet. As well as giving you an overview of your project, Table View allows you to sort, filter and rearrange your project information, so you can customize the display depending on your needs. It’s the perfect layout for keeping on top of your team’s actions, progress and due dates. Here’s how to customize Table View in Hive.
First, select the project you want to view from your navigation bar. At the top right of the screen, you’ll see the ‘Change Layout’ option. Click on ‘Change Layout’, then click the ‘Table View’ option to open the display.
Once you’ve opened Table View, you’ll see a table with rows and columns. The rows represent the action cards within your selected project, and the columns represent the information components from the action cards, such as Due date, Status and Assignees.
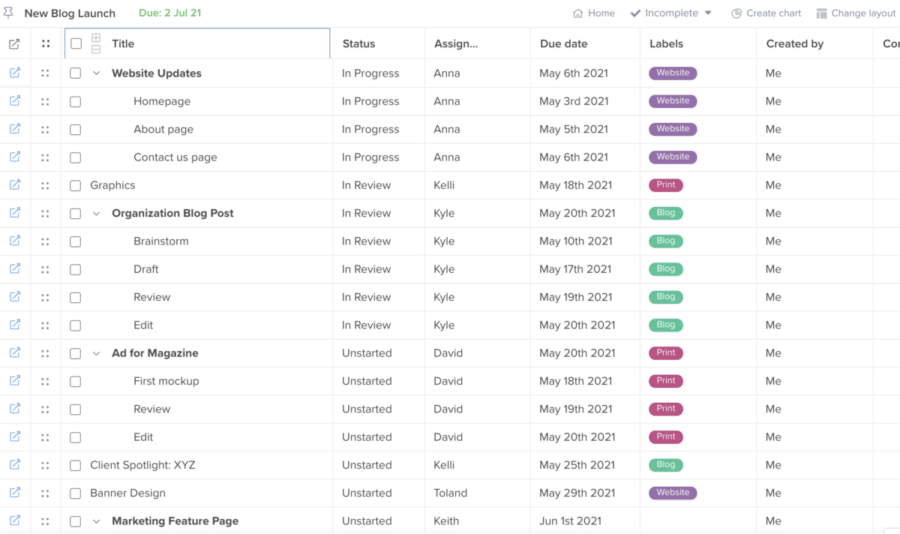
On the far left of each row, you’ll see a small icon featuring an arrow and a square. Clicking on this icon will open the action card and give you a quick overview of its details, such as Time-tracking and Priority Level. Right next to the arrow and square icon is a four-dot icon. If you want to reorder your rows, click on the four-dot icon, then drag and drop the rows into a new order.
Customizing columns in Table View
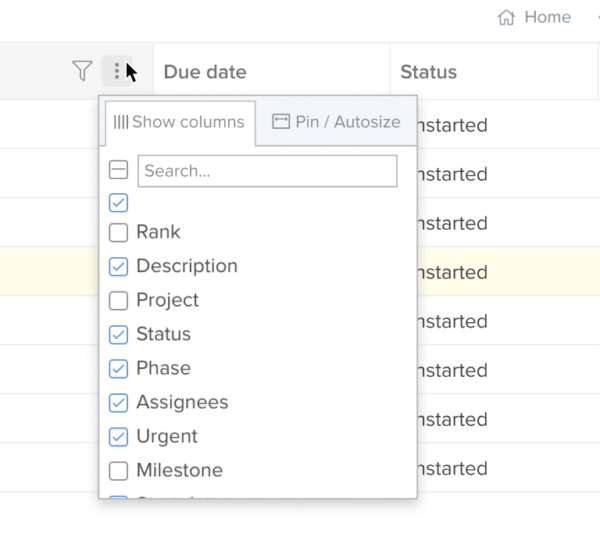
You can customize the details displayed in the table by adding and removing information columns. To get started, move your cursor to the top of any column. When your cursor is over a column’s title, a three-dot icon will appear to the right of the title. Click on the dots and you’ll see a small box displaying the column menu. The menu shows a list of information options such as Phase, Due time, or Last updated. There is a checkbox next to each option. You can select the options you’d like to display as columns by clicking the checkboxes. Likewise, you can deselect the checkboxes of the options that you do not want to display.
Once you’ve customized your column options, you can drag and drop the columns to rearrange the order they appear in the display.
How to filter information in Table View
Table View offers a range of useful filters to help you view specific details within your project.
Let’s look at the filter that sorts action cards by their status and history. In the top menu bar, click on the word ‘All’ to open up a range of options, including ‘All’, ‘Incomplete’, ‘Completed this week’, ‘Completed last week’ and ‘Exclude old actions’. These options allow you to view the action cards according to their status, so for example, if you click on ‘Completed last week’ only the action cards that w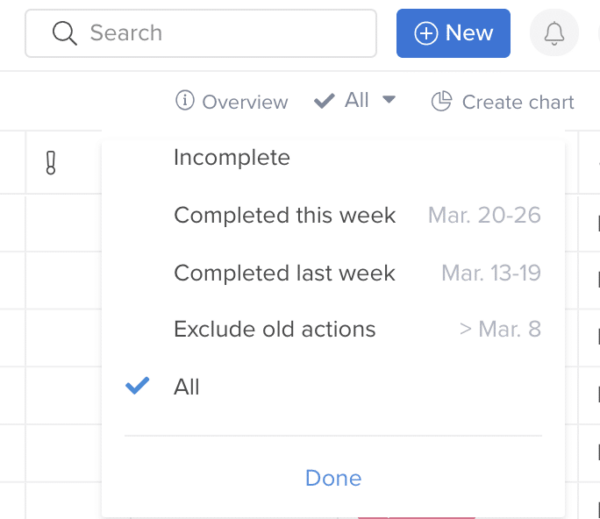 ere completed last week will display in the table. This is a useful filter if you want a quick overview of your work in progress. When you’ve finished, set the filter back to ‘All’ to display all the action cards in the table.
You also can set up filters in your columns. To do this, move your cursor to the top of the column you want to filter. Once your cursor is over the title of the column, the filter icon will appear. Click on the icon to bring up the filter options for that specific column. There is a checkbox next to each option. You can select the filter you wish to apply by clicking the checkbox.
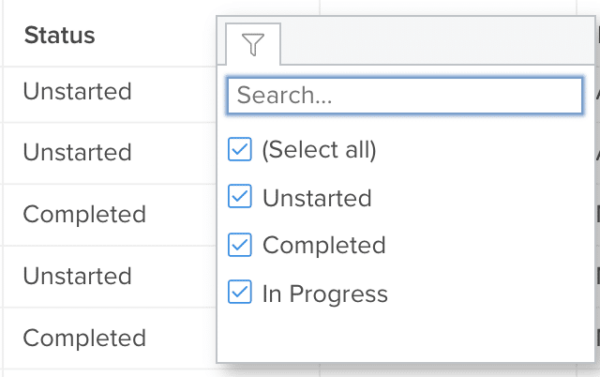
Note that the filter options will be different for each column as the choices available relate to the specific information for each column. So, for example, the Assignee column would have a list of the people assigned to the project, while the Status column would have Status options, such as Complete, In Progress or Unstarted.
In the white checkboxes to the left of the Title column, you can click and select to delete actions, archive them, mark them completed, and follow or unfollow that action.
Editing information from Table View?
As you can see, Table View offers you and your team a versatile and flexible way to view, organize and edit action cards and project information, but that’s not all! You can do even more in Table View, including sorting and filtering information, creating charts to visualize project data, bulk updating items and more.
Read our blog post on how to create charts in Table View. And watch our video to discover how you and your team can get the most out of Table View.

Learn how you can make the most out of Hive. Check out our video tutorials and handy how-to guides.