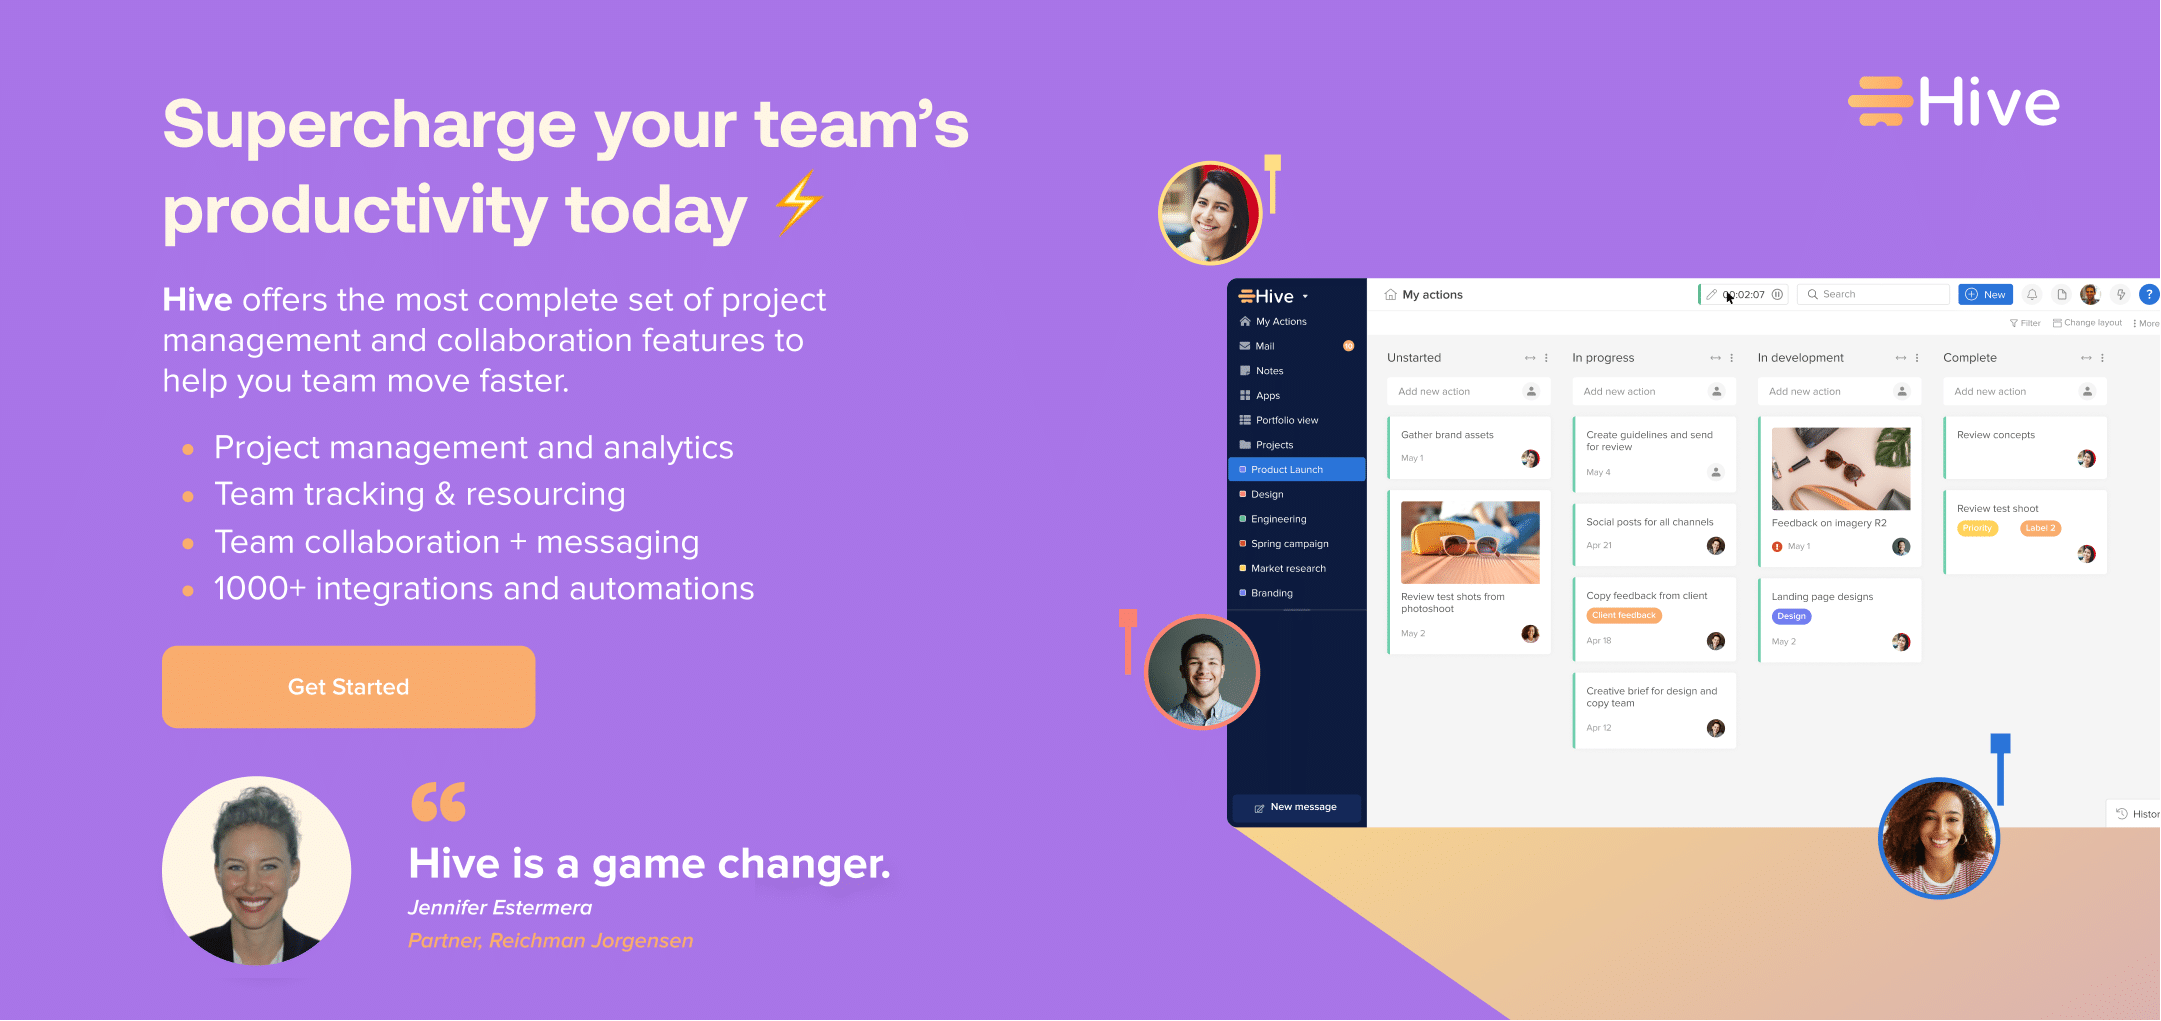
Project management dashboards are visual tools that help project managers track project progress, identify project risks, and efficiently assign tasks to team members. In addition, these dashboards have custom reports that allow you to quickly check project status, making it easier to optimize resources and time check your usage.
Your project management dashboard can be built any way you like. Still, they typically contain graphs, charts, and other visual representations of project data that can be used for project tracking and reporting.
But where does this data you are pulling come from? Simple. This data is pulled directly from the project management system you work in (like Hive). Built with time-tracking tools, project planning software, and other workplace productivity tools, your dashboard works within the confines of the project management tool you use daily. It is a simple way to make any project overview more comprehensive and easier to read than looking at multiple separate reports.
Why Use Project Management Dashboards?
Project management dashboards are vital when it comes to managing projects effectively. Without a tool like Hive, you may have to look at spreadsheets in Excel and write text manually in word documents to cross-reference. Well good news — it doesn’t have to be that time-consuming.
Using a custom project management dashboard, you can get a clear view of what is happening on any project in real-time instead of manually creating multiple reports, which can take hours or days depending on the number of tasks involved.
Overall, dashboards provide an easy-to-read overview of multiple projects and tasks, alerting project teams to any issues and progress against targets. They also help with tracking resource utilization, budgeting, forecasting, and other important metrics. With real-time data and comprehensive analytics, project management dashboards can give organizations valuable insights into their operations and projects, including identifying any potential bottlenecks and areas of improvement.
These dashboards are even more important as we’ve shifted towards remote and hybrid working models — it’s imperative that team members know what is going on across their organization, and not just in their silo.

How To Create The Perfect Project Management Dashboard
Creating the perfect project management dashboard can be challenging, but it’s an important step in effectively managing projects and ensuring they are completed on time and within budget. While this can be subjective to the project you are looking to track, there are a few key steps to follow when creating the perfect dashboard.
Landing on the ideal dashboard to measure the metrics you want for your project is going to take some time and practice, but here are some tips to get started:
1. Keep your project management dashboard focused on project objectives.
Your project goals should be clearly stated in your project dashboard, so everyone knows what they are working towards.
2. Choose a project management tool that best fits your project needs.
This will make it easier to track progress and assign tasks within the same platform. In other words, don’t use Hive for half of your projects and Excel for the other. Create all your projects in a single project management tool and save yourself the headache of working on multiple platforms. The chance for human error in transposing numbers and graphs is also going to lessen as well.
3. Utilize graphs, charts, and other visual tools to display project data in real time.
This makes it easy to identify potential issues quickly and accurately assess project performance at all stages of the project lifecycle.
4. Focus on project scalability.
As project goals and objectives change, you may need to adjust your dashboard. Make sure your project dashboard is flexible enough to accommodate changes in project scope and requirements as the project progresses.
5. Don’t forget about security.
Your project management dashboard should be secure so that only authorized team members can access it—this is essential for protecting sensitive information and confidential project data like budgets or customer information.
The Best Project Management Dashboard Tools
1. Hive
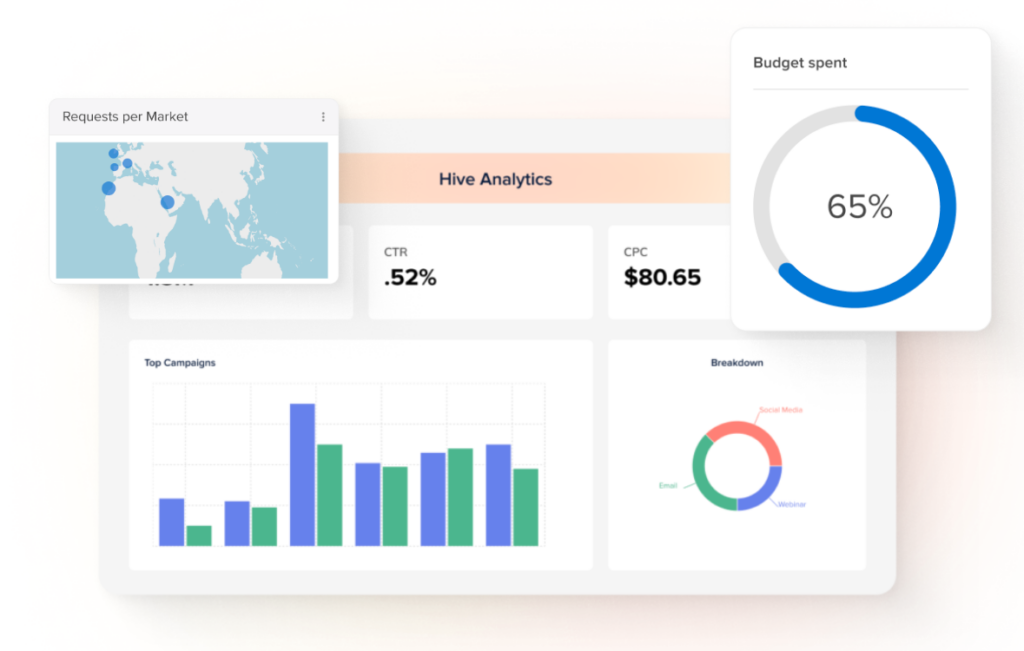
Hive is one of the most comprehensive project management dashboards for projects and teams of all sizes. With Hive’s project dashboard, you can easily track project status in real-time, assign tasks to team members, keep up with progress reports from each task owner, and monitor milestones. The dashboard also offers a great visual representation of your project, so it’s much easier to read than looking at multiple separate reports or spreadsheets.
Within Hive, Pages serve as your personalized hub for everything happening in your workspace, pulling together important information in just a few clicks. Once you’ve created a page, add widgets to view project data in a table, bar chart, completion graph, custom embed, or many other formats. You can also stack, add, and delete your widgets in real-time. It’s a fully customizable dashboard for any and all of your project needs.
So whether you’re managing a straightforward project or a large-scale initiative that requires multiple stages of approval and execution, Hive is the perfect platform to get started on creating the ideal project management dashboard for your team.
Get started with Hive’s free 14-day trial and create your own project management dashboard today!
Some of Hive’s features:
- Customizable widgets: You can create dashboards that are tailored to your specific needs.
- Data visualization: Choose from charts and graphs, such as bar charts, line charts, pie charts, and tables to visualize your data in a way that is easy to understand and interpret.
- Goal tracking capabilities to measure progress towards individual and collaborative team goals.
- Filters and drill-downs: Access your data to have more granular insights, which makes it easier to spot trends, bottlenecks, and areas for improvement.
- Collaboration: Hive dashboards can be shared with other users, allowing teams to collaborate on projects and track progress.

2. Airtable
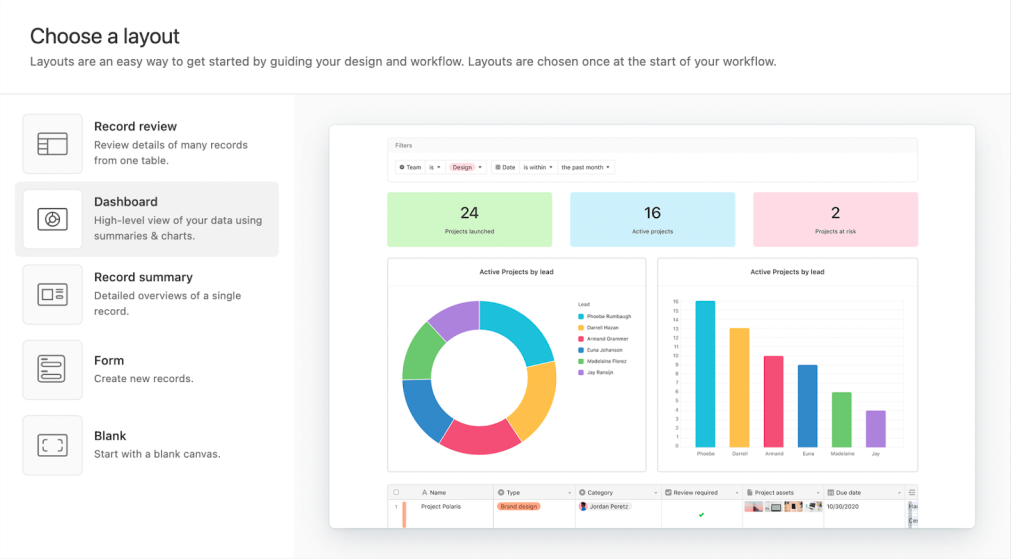
Airtable is a project and task management software with the capability to create KPI dashboards. Its completely customizable Interface Designer’s dashboard layout lets you aggregate information, highlight trends, or visualize distribution in charts and graphs. You can sync the data you need to display on your KPI report directly from your Airtable base into a reporting dashboard.
Airtable also offers different views for your data, such as Kanban boards, Gantt charts, and calendar views. With the dashboard layout, Airtable lets you pull information from other tables in editing mode. Another great feature Airtable Dashboards offers is the ability to let users filter the information they need, so you don’t have to display lots of points of data on a timeline, grids and charts.
Airtable has a free plan with limited functionalities and a paid plan starting at $20/month. But, if you are on their enterprise plan, you can customize your interfaces to be even more dynamic and secure by using the user groups feature.
Some of Airtable’s features:
- Interface customizable designer
- Different views: Kanban, calendar, Gantt chart and list
- Automation and integrations
- Sync data across teams and tables
- Comprehensive reports
Unsure if Airtable is the best project management dashboard solution for your team? See how Airtable compares to others in the same category.
3. Monday.com
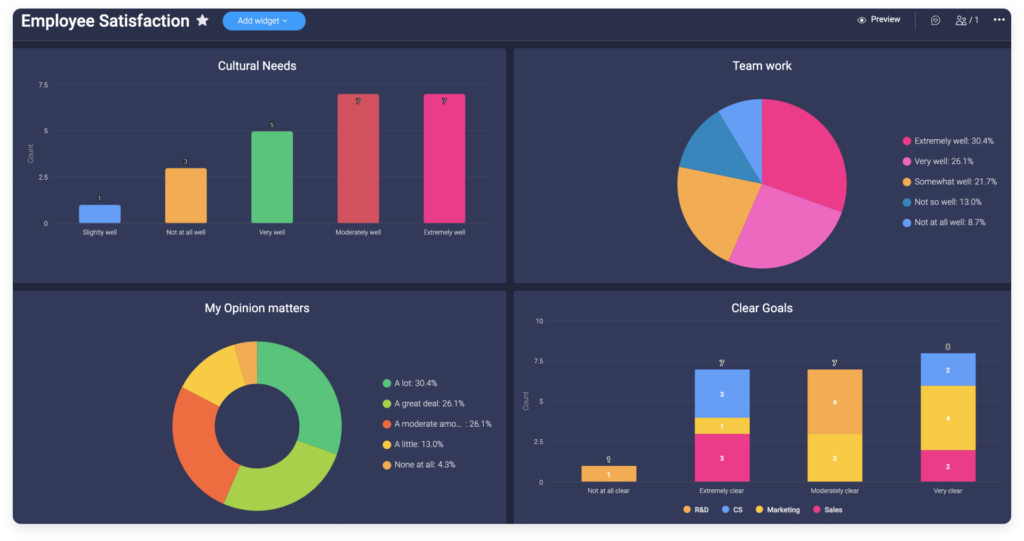
Monday.com is a project management software designed for workflow organization and project planning. Its visual dashboards make it easy to comprehend your projects’ statuses and progress at a glance, and it allows you to use customizable templates that match your workflow. Monday.com has over 30 available widgets and apps to customize their dashboards and make it easier to track projects’ progress, budget and deadlines.
Keep in mind that the amount of widgets and customizations available to you will depend on the plan you have with Monday.com. If you decide on their Enterprise plan, for example, you will be able to view high-level details of a Private Dashboard such as its name, subscribers, and creation date via the content directory. Monday.com’s basic plan starts at $8 and lets you create a dashboard based on 1 board. For more dashboard options, you will have to spend more money. Their standard plan starts at $10 per seat/month and lets you create a dashboard that combines up to 5 boards.
Some of Monday.com’s features:
- Customizable templates
- Visual dashboards
- Automate repetitive tasks
- Extensive integrations with many popular third-party apps and tools
- Timeline and Gantt views
- Collaborative workspaces and team communication within the platform
Check out some alternatives to Monday.com and compare them to find the best task management platform for your company.
4. Wrike

When it comes to dashboards, Wrike does a decent job in showing visual data in a clear framework. However, each dashboard created in Wrike can only belong to one space. Even though, the dashboard can contain data from any number of other folders, projects, and spaces, there’s a limit to the number of dashboards you can create. Users on Professional accounts can have up to 10 dashboards, users on Business accounts can have up to 50, and users on Enterprise accounts can have up to 200. Dashboards are an exclusive paid feature on Wrike. The software has built-in time tracking, advanced reporting, and resource management features that make it more suitable for larger teams working with complex, multi-stage projects. Wrike has a free plan with limited capabilities. Their most popular plan starts at $24.80 per month/user, but you can get great features under a lower tier called “Team” for $9.80 per month/user.
Some of Wrike’s features:
- Integrates with various applications like Google Drive, Slack, Salesforce, and Adobe Creative Cloud
- Personalized dashboards for important tasks, updates, and project overviews
- Built-in proofing and approval tools
- Workflow automation to eliminate manual tasks
- Security features including role-based access, two-factor authentication, and data encryption
Check out some alternatives to Wrike and compare them to find the best task management platform for your company.
We hope you’ve learned about the benefits of using project management dashboards and how you can create the perfect dashboard that functions seamlessly within your workflow. And if you don’t use a project management dashboard yet, I think it’s about time you start.
